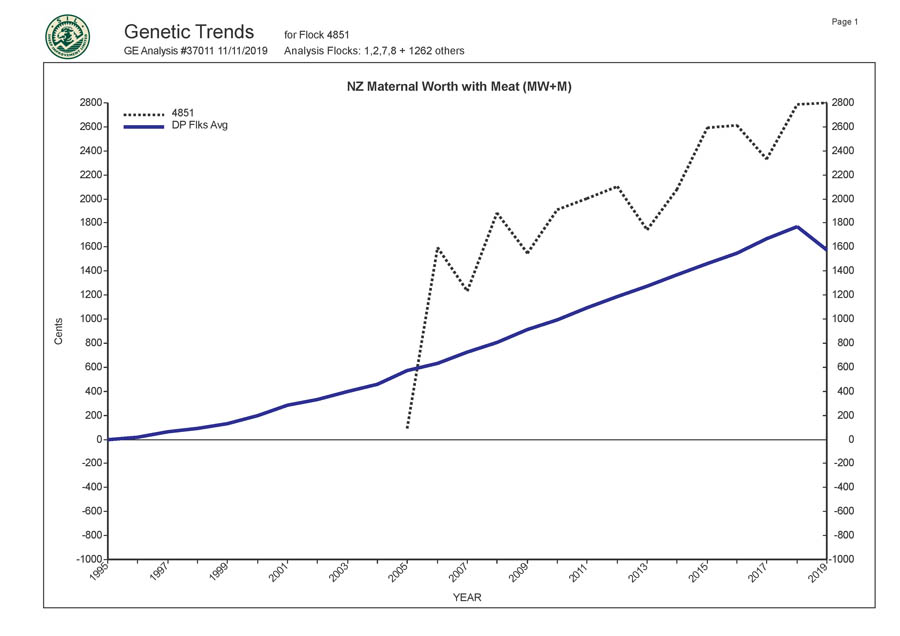
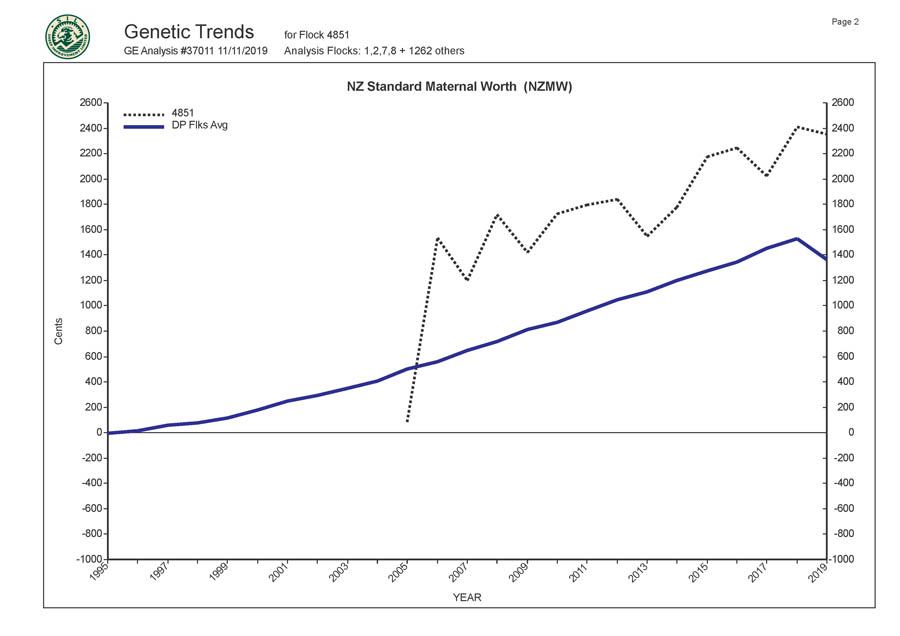
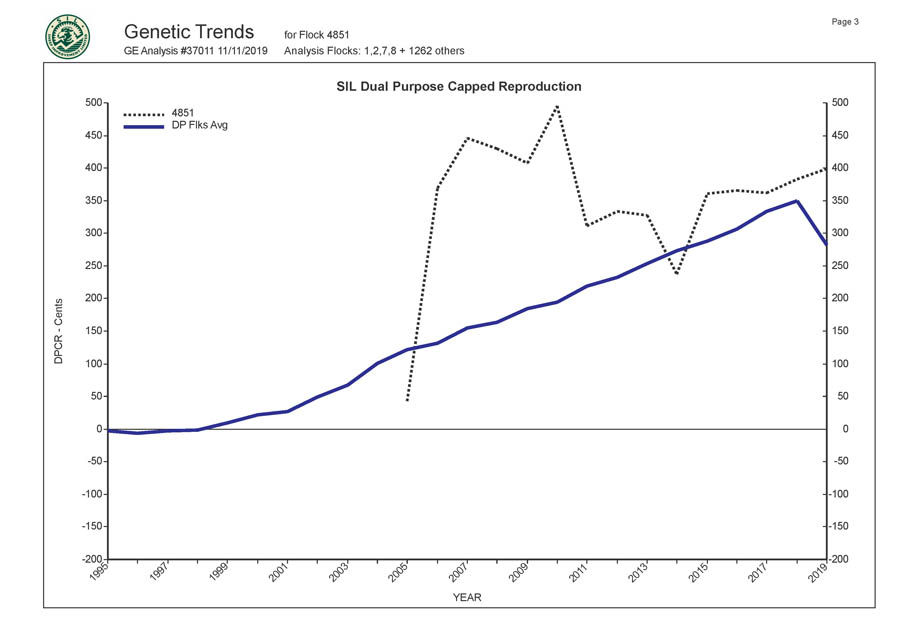
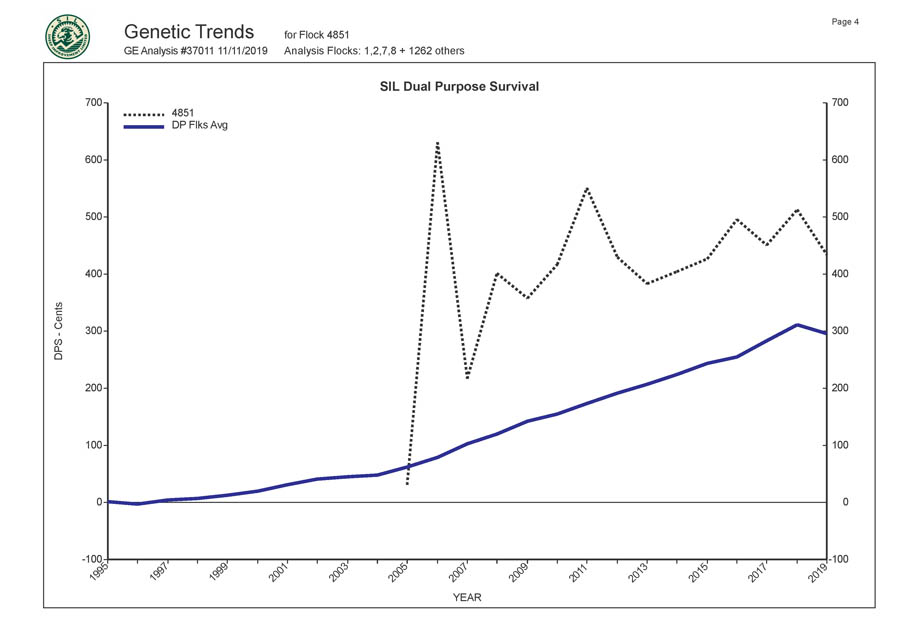
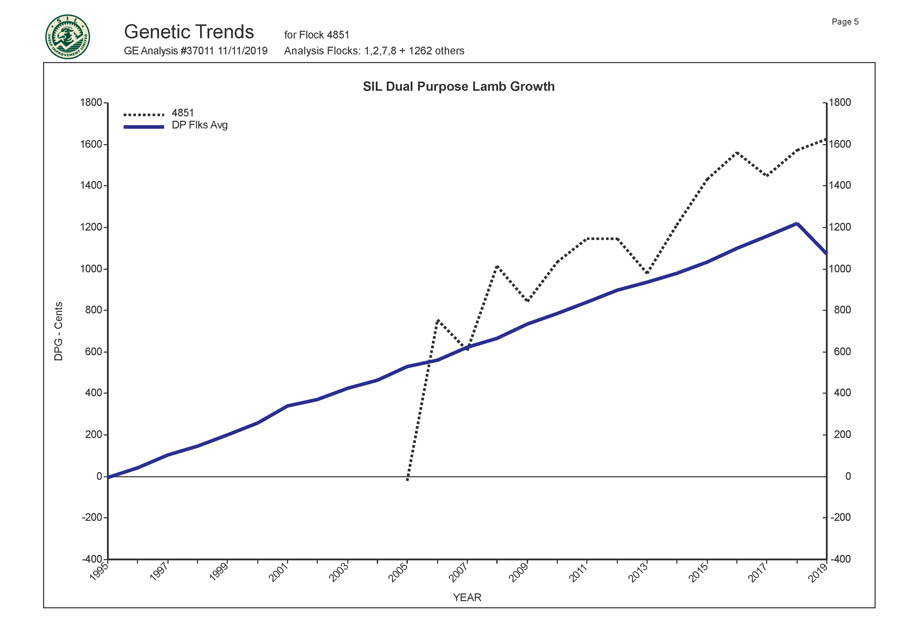
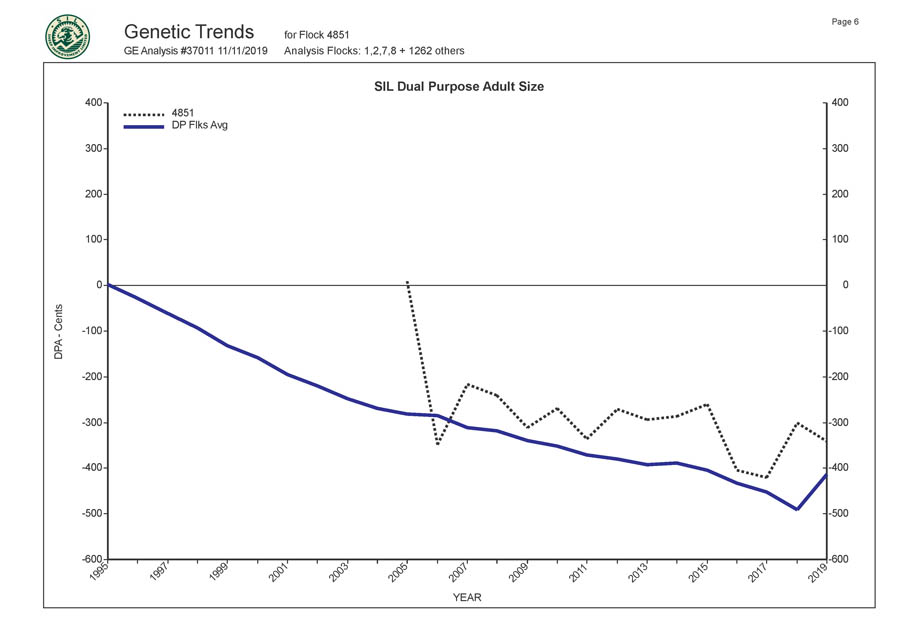
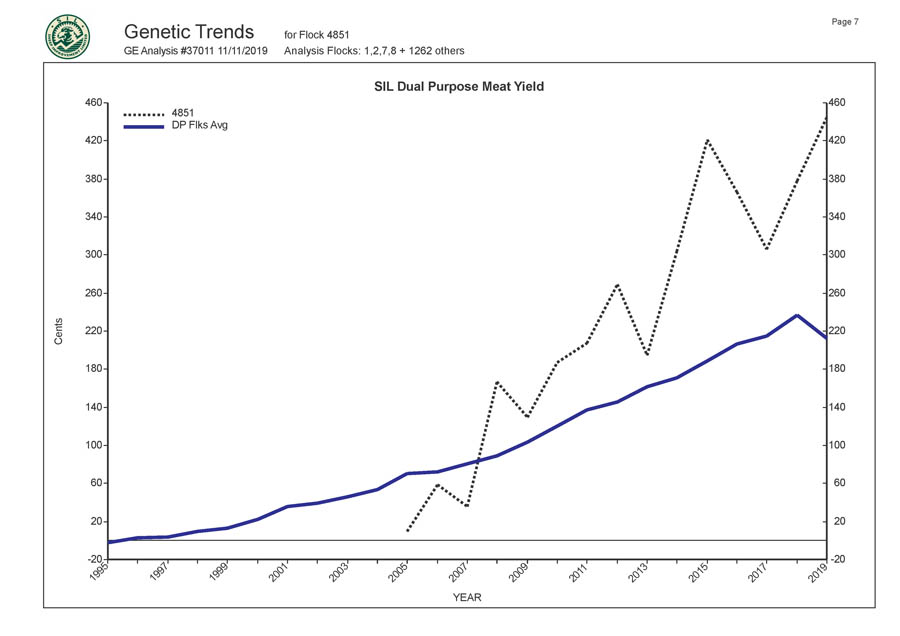
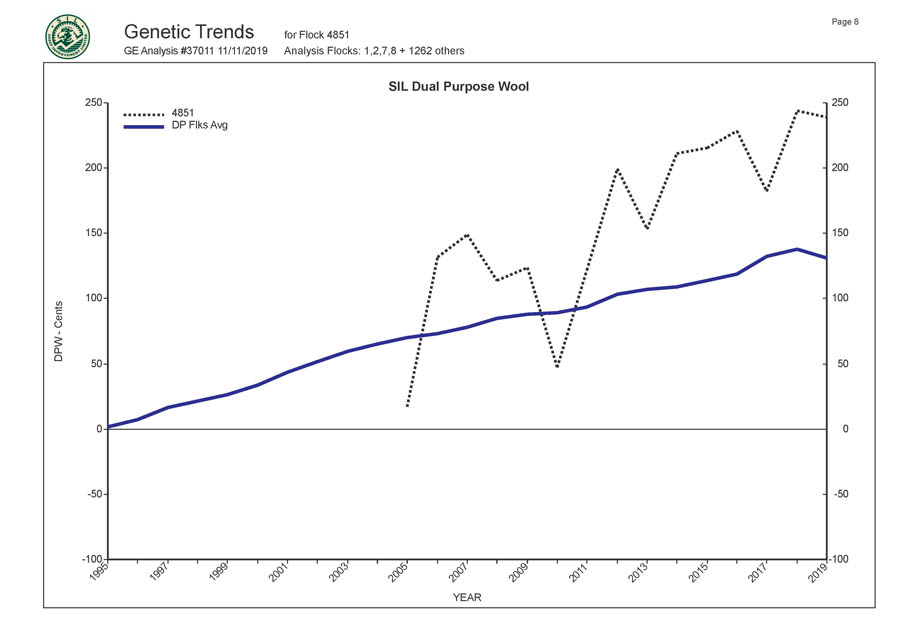
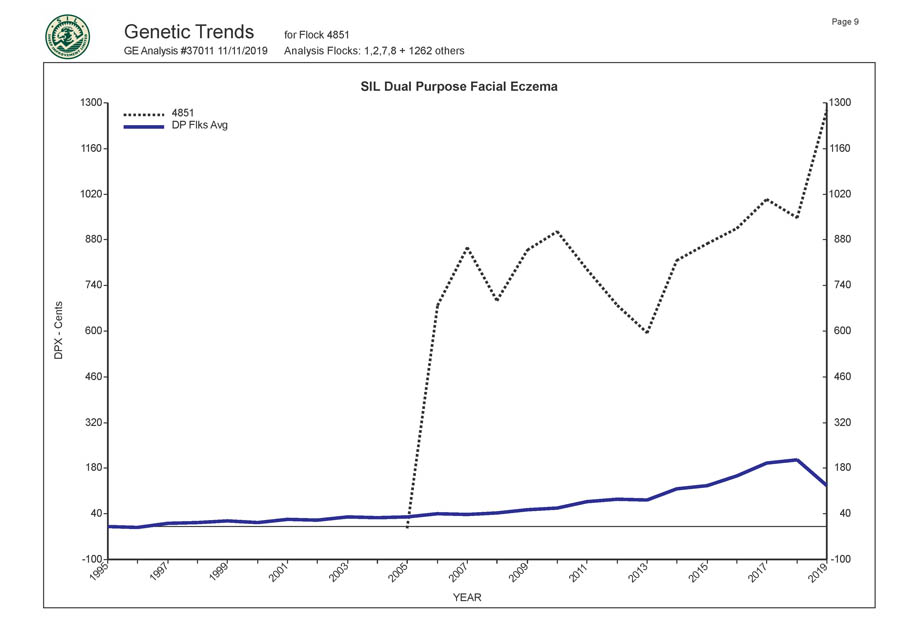
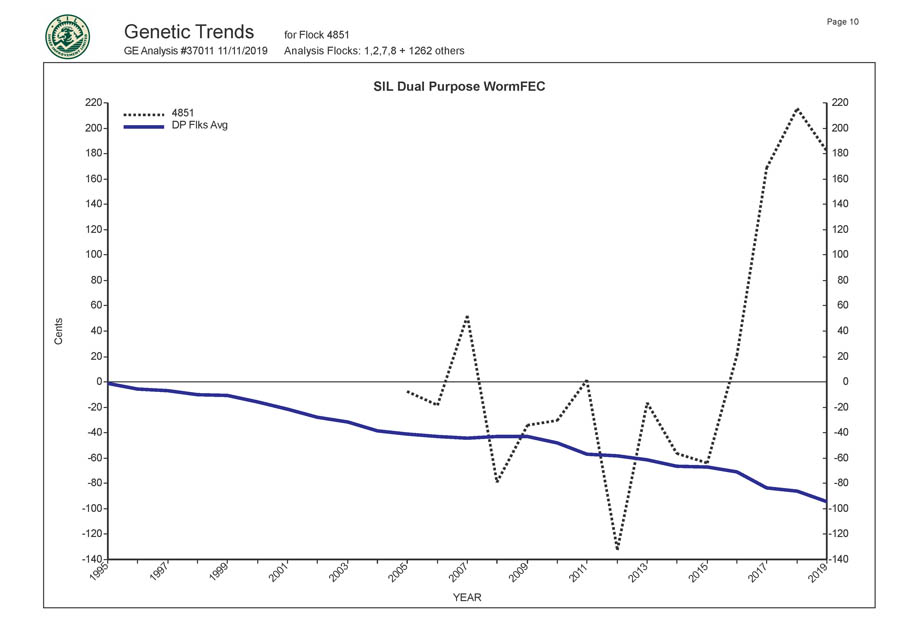
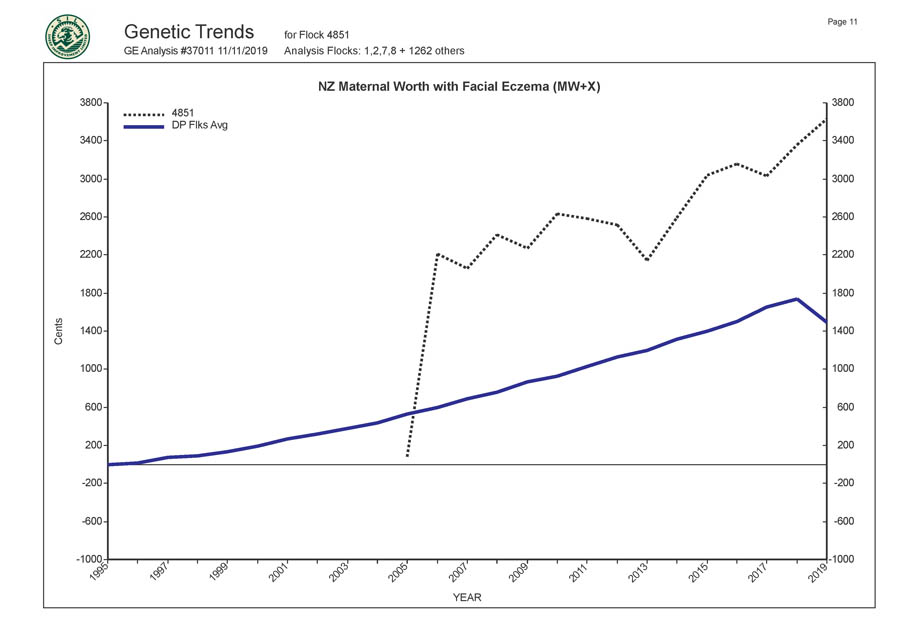
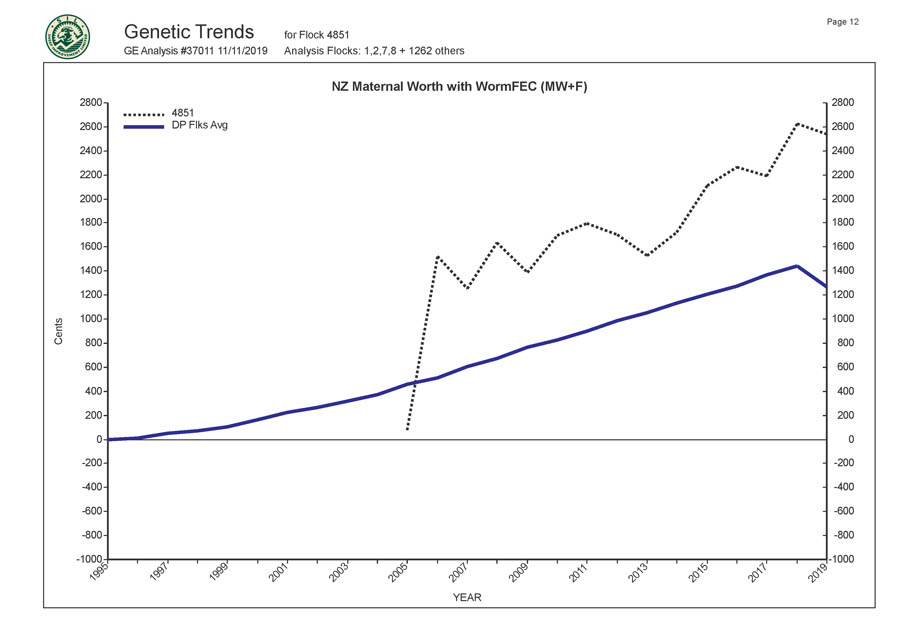
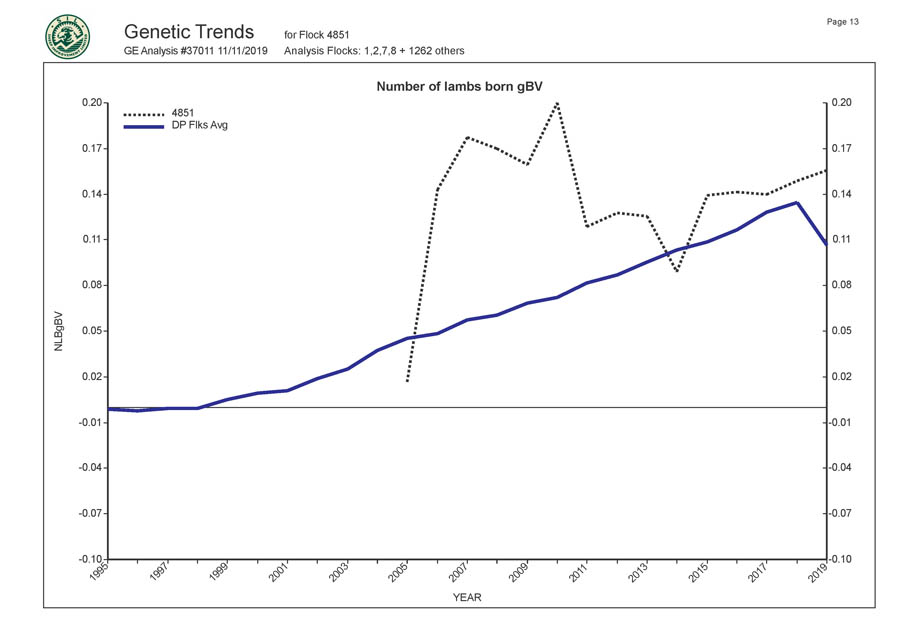
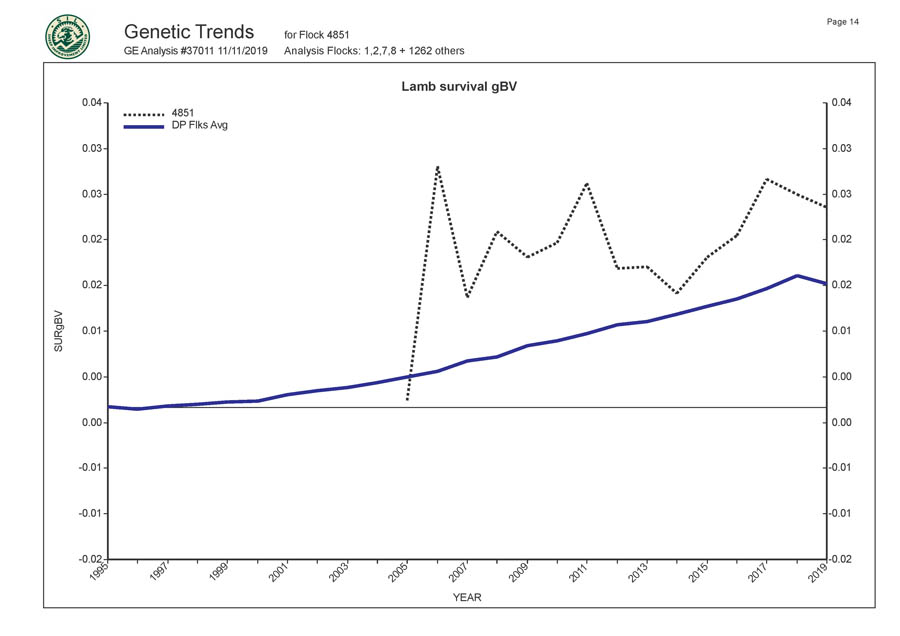
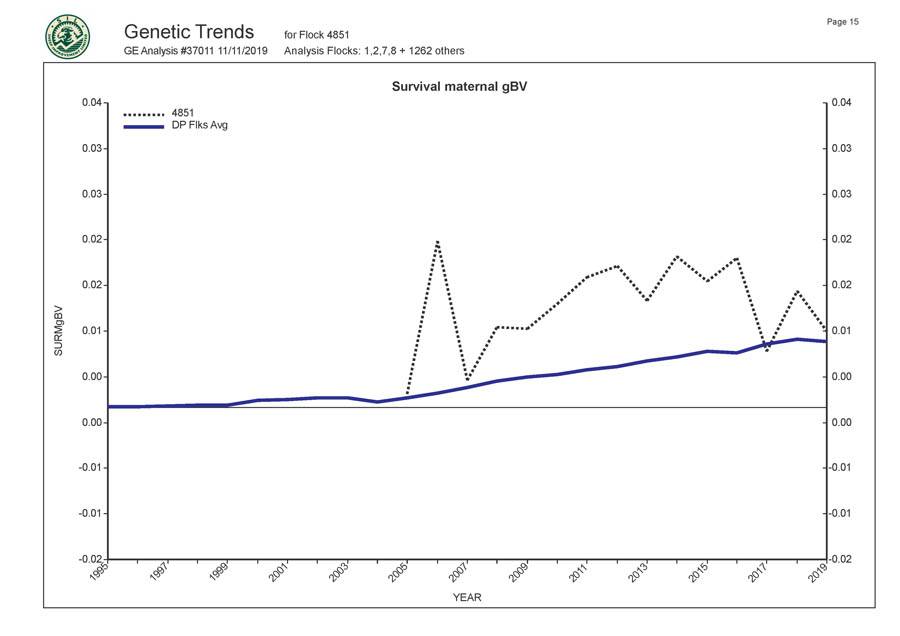
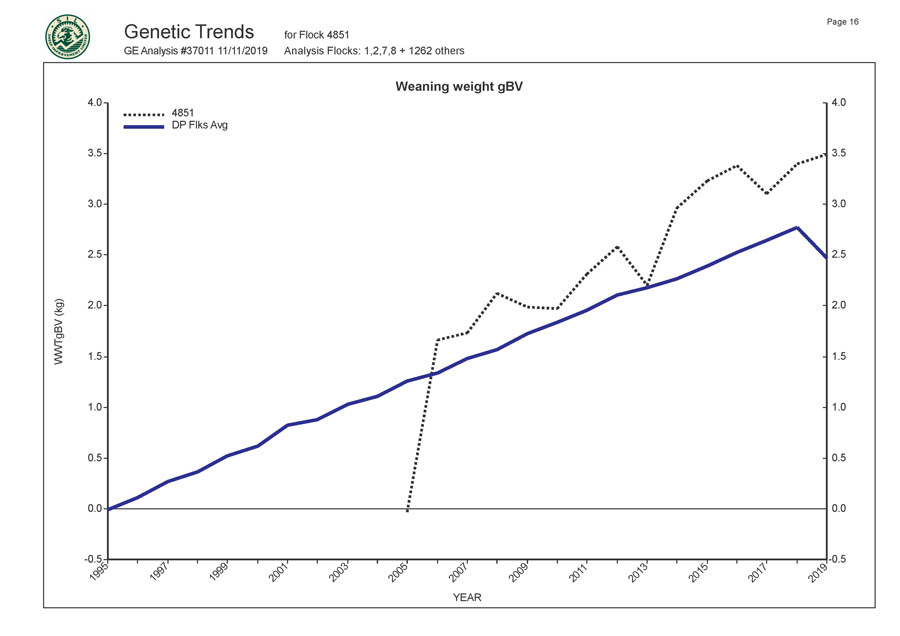
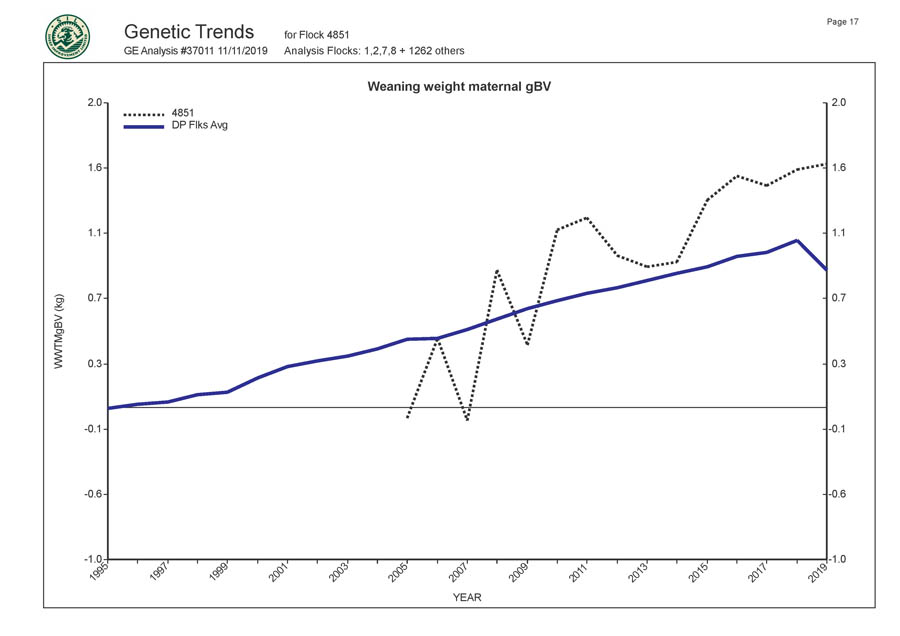
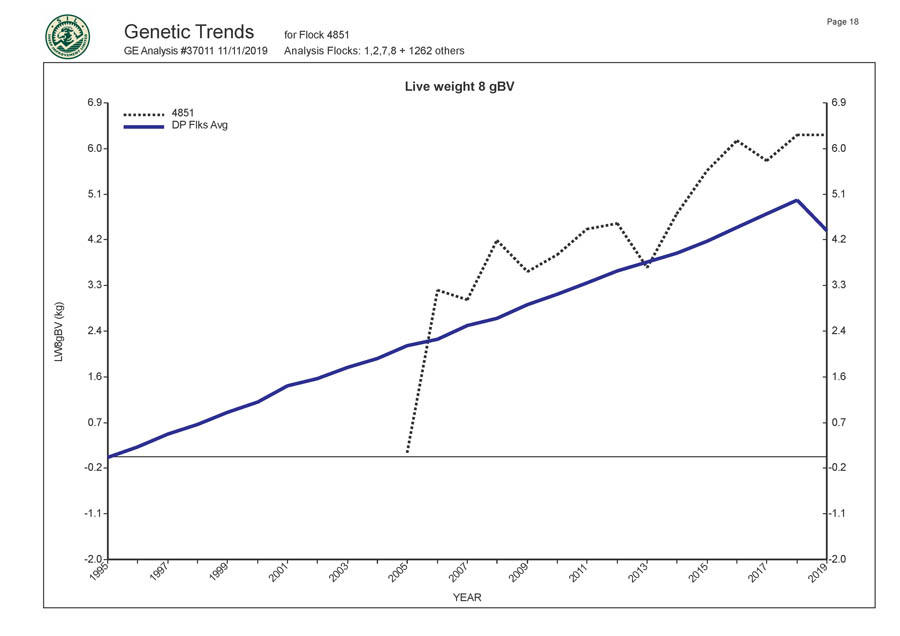
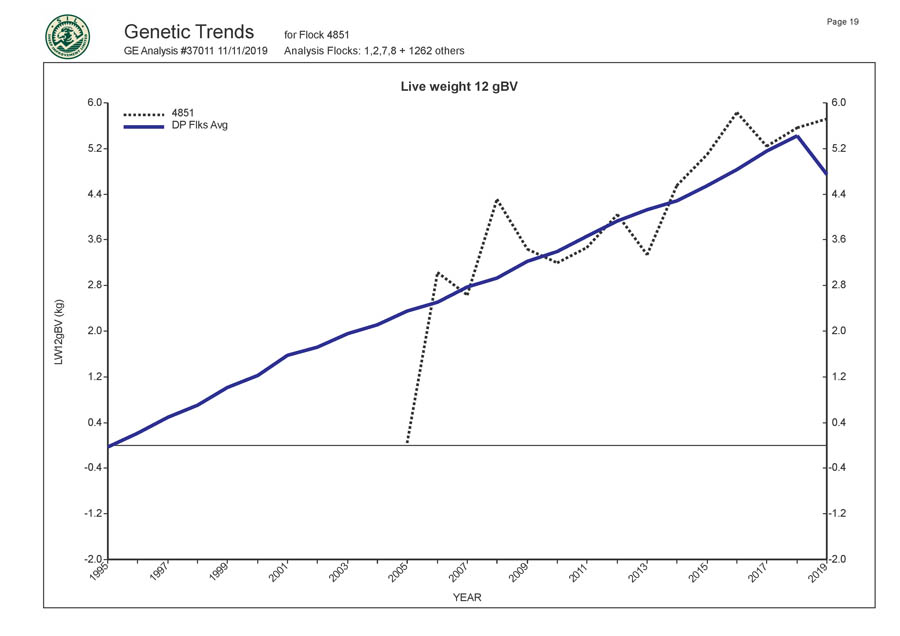
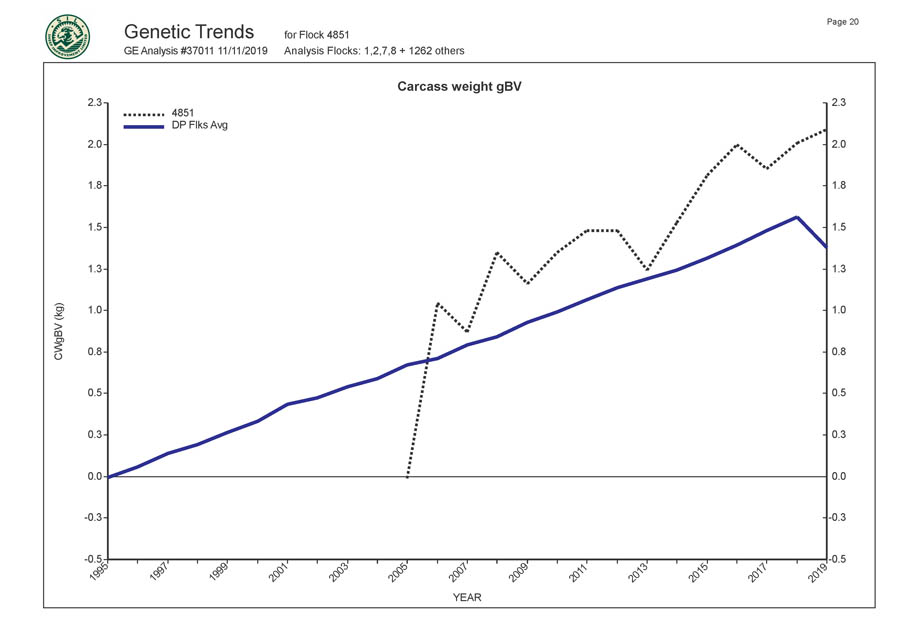
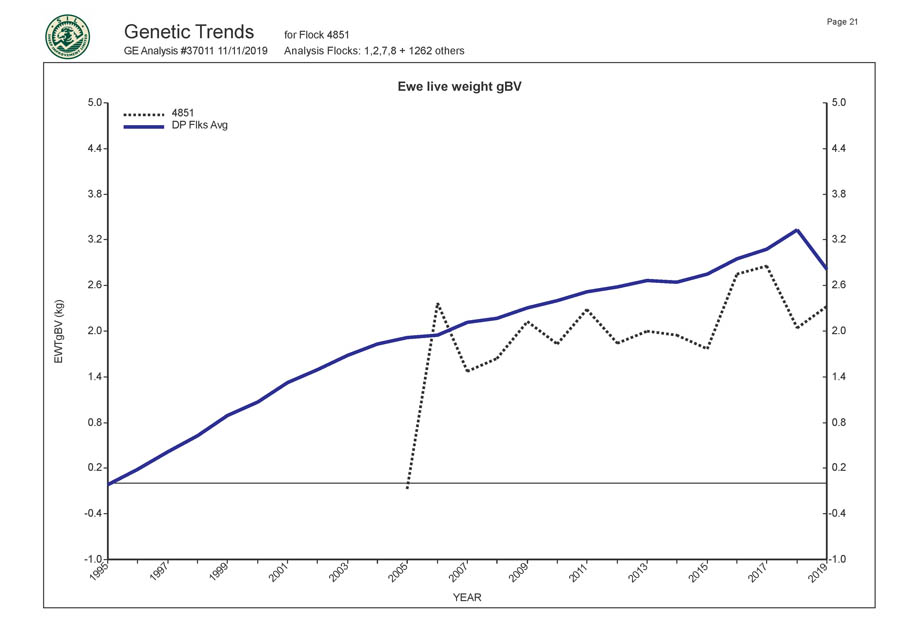
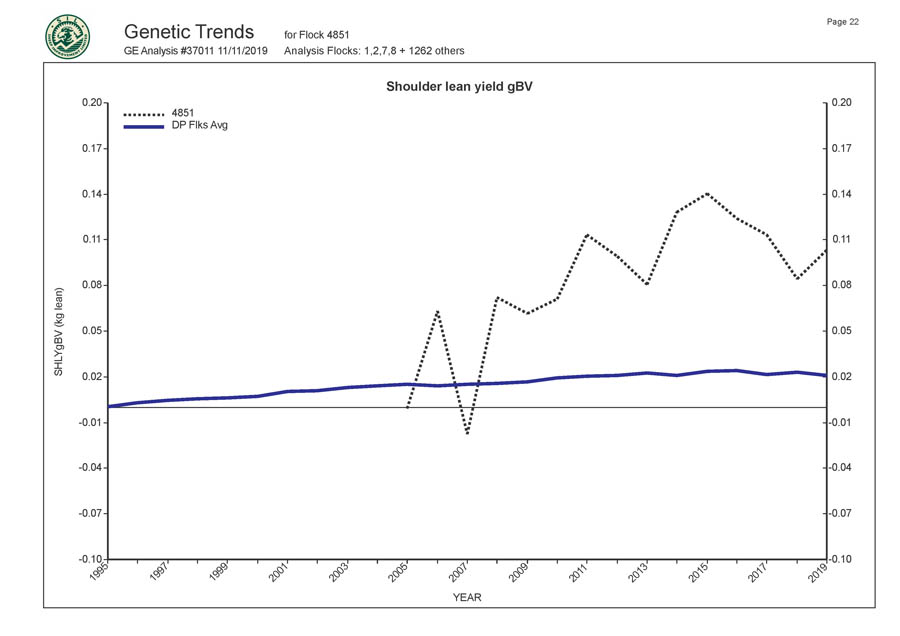
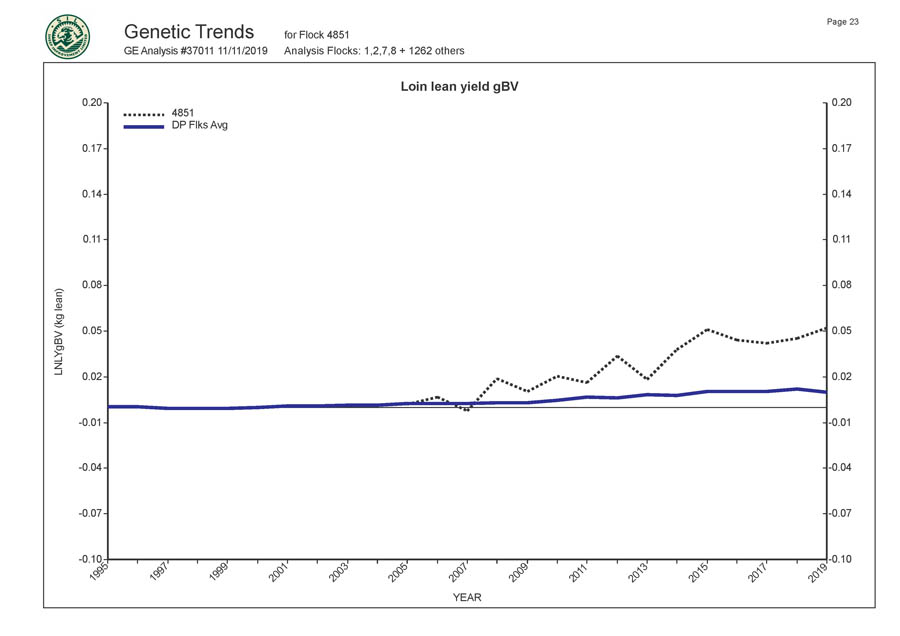
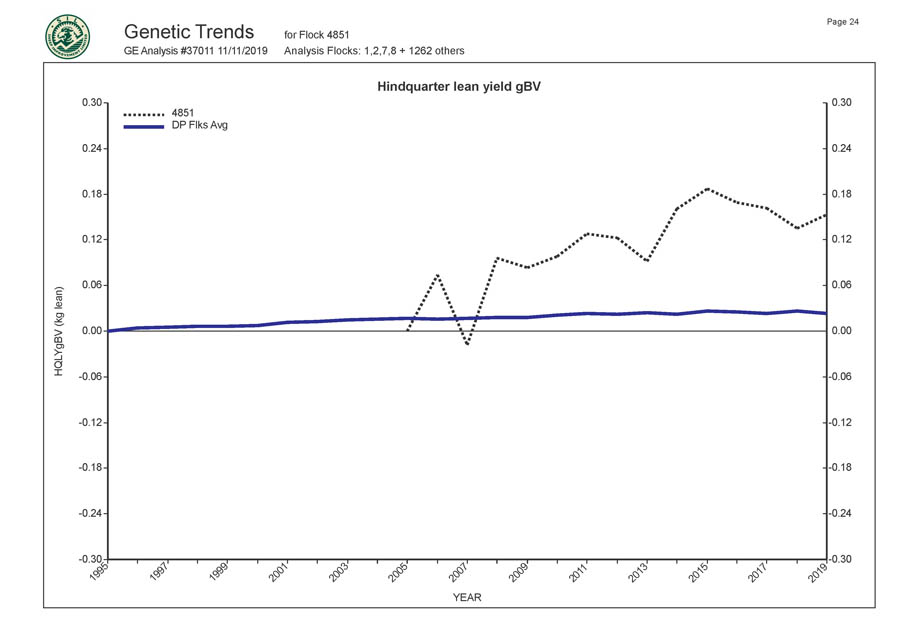
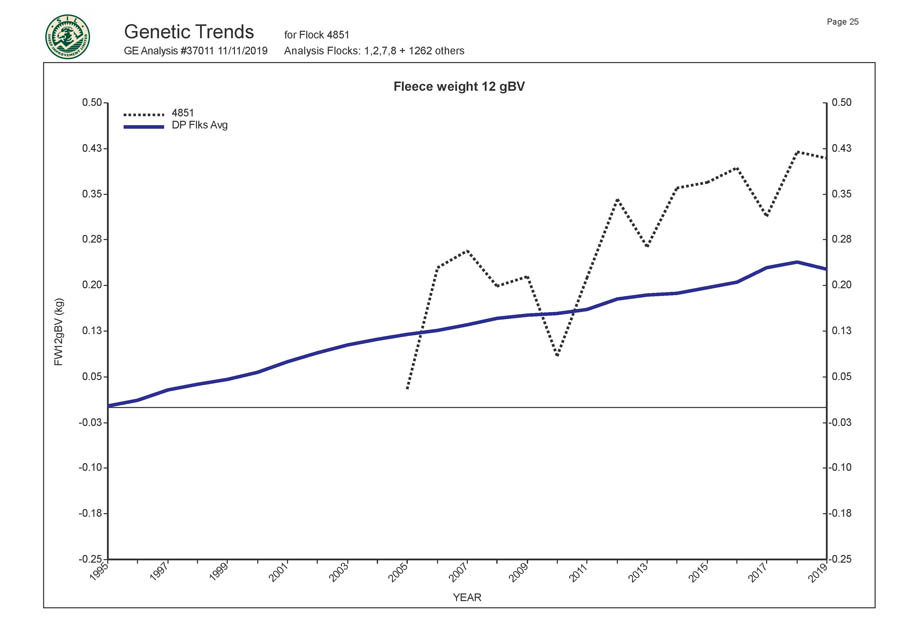
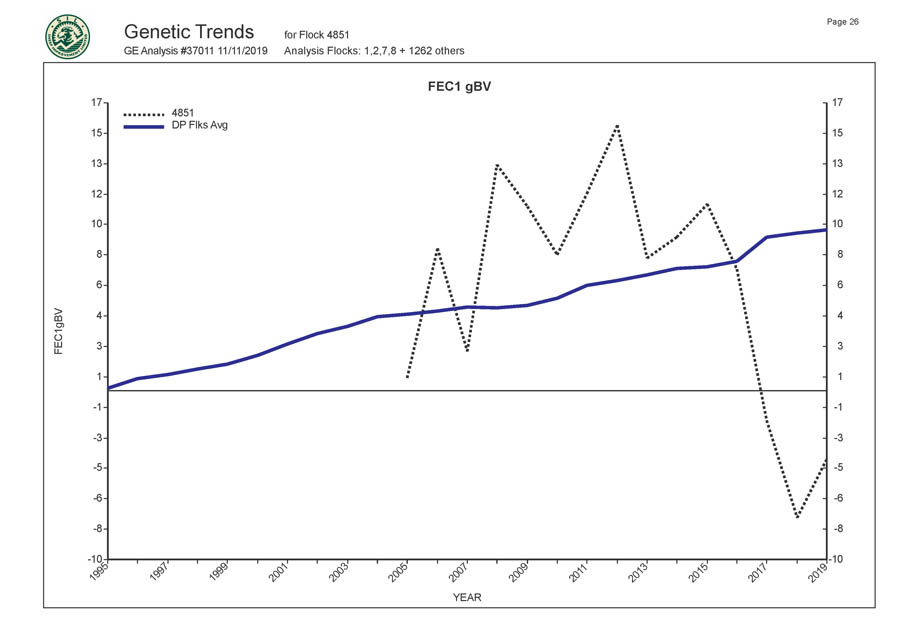
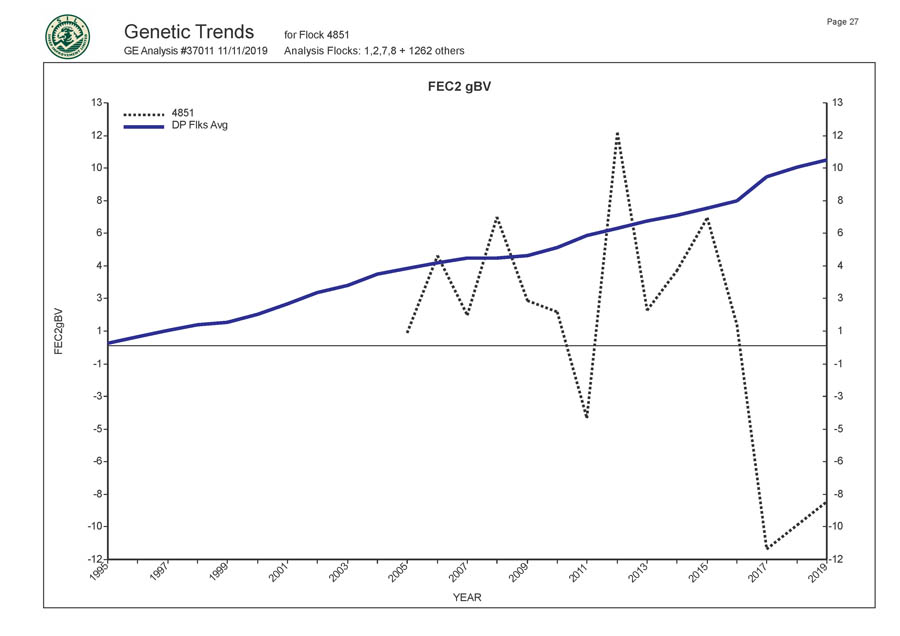
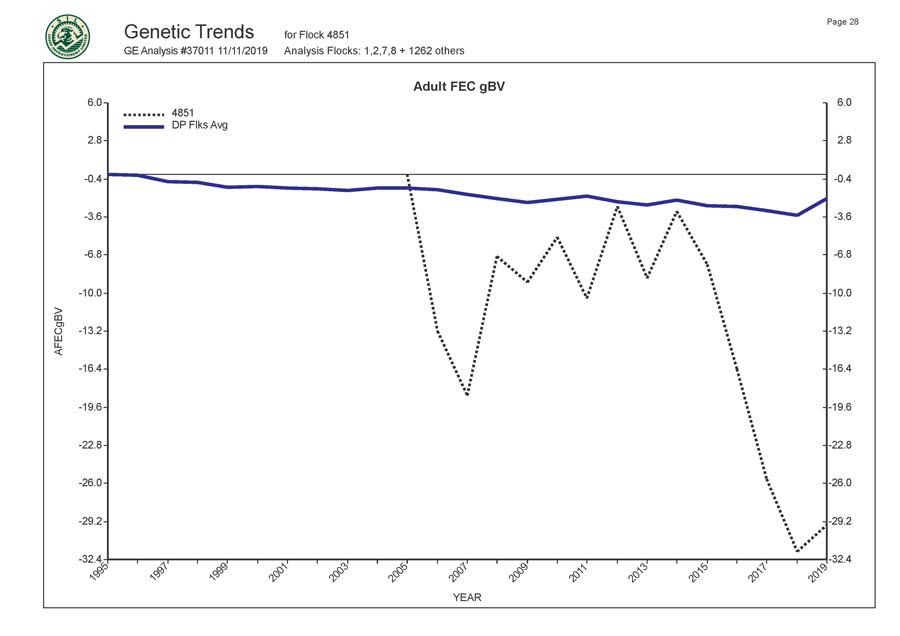
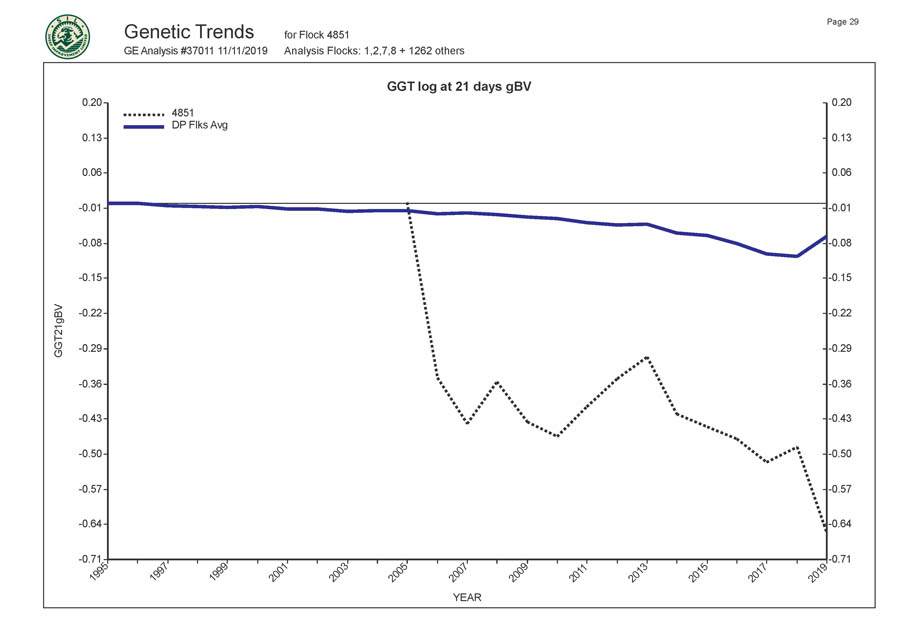
Genetic trend graphs show progress in genetic improvement of a flock over time. As more data is added into the SIL database, such as when lambs are weighed at weaning, or lambing records entered, the index of each animal changes. This can go up or down according to the performance of the individual, in comparison to its flock-mates, and according to the performance of all that individual's relatives.
The trend graphs show the average index of the flock year by year, and allows progress to be seen easily. The graphs below show our Romani flock compared to all the other maternal breed flocks recorded on SIL, which is about 1200 flocks nation-wide.
As you can see, The Romani Farms Coopworth flock is well above average for nearly all traits - and for some traits, more than double the value of the national average.
For Flock 4851.
GE Analysis #37011
11/11/2019
Analysis Flocks 1,2,7,8+1262 others
Address:
656 Ngapuke road, Taumarunui
Phone:
07 895 7144
Email:
romani@farmside.co.nz

© 2017 Romani Farms All Rights Reserved
Website by Acre PC
© 2017 Romani Farms All Rights Reserved
Website by Acre PC